
Показаны сообщения с ярлыком monitoring. Показать все сообщения
Показаны сообщения с ярлыком monitoring. Показать все сообщения
2015/09/10
Observium
На глаза попался еще одно средство монторинга: Observium — Network monitoring with intuition. Платный. Бесплатный на один сервер :) Однако, я очень жду Zabbix 3.0. Пока же доступна только альфа версия Zabbix 3.0.0alpha2 от 09/09/15. Если верить планам команды Zabbix, релиз 3.0 выйдет примерно в ноябре.

2015/03/05
Logstash forwarder — отправляет логи с помощью lumberjack на logstash.
Packer — is a tool for creating identical machine images for multiple platforms from a single source configuration.
Docker — An open platform for distributed applications for developers and sysadmins.
Serf — is a tool for cluster membership, failure detection, and orchestration that is decentralized, fault-tolerant and highly available.
Heka — is a tool for collecting and collating data from a number of different sources, performing "in-flight" processing of collected data, and delivering the results to any number of destinations for further analysis. (Documentation). Introducing Heka.
ImmutableServer
Etcd — is an distributed key value store that provides a reliable way to store data across a cluster of machines. It’s open-source and available on GitHub. etcd gracefully handles master elections during network partitions and will tolerate machine failure, including the master. (official site).
Fluentd vs Logstash
Saltstack — Salt, a new approach to infrastructure management, is easy enough to get running in minutes, scalable enough to manage tens of thousands of servers, and fast enough to communicate with those servers in seconds. PyPI link
Why Averages Suck and Percentiles are Great.
monigusto — living the 'monitoring up' dream. (набор chief рецептов для построения системы мониторинга на Ubuntu).
Packer — is a tool for creating identical machine images for multiple platforms from a single source configuration.
Docker — An open platform for distributed applications for developers and sysadmins.
Serf — is a tool for cluster membership, failure detection, and orchestration that is decentralized, fault-tolerant and highly available.
Heka — is a tool for collecting and collating data from a number of different sources, performing "in-flight" processing of collected data, and delivering the results to any number of destinations for further analysis. (Documentation). Introducing Heka.
ImmutableServer
Etcd — is an distributed key value store that provides a reliable way to store data across a cluster of machines. It’s open-source and available on GitHub. etcd gracefully handles master elections during network partitions and will tolerate machine failure, including the master. (official site).
Fluentd vs Logstash
Saltstack — Salt, a new approach to infrastructure management, is easy enough to get running in minutes, scalable enough to manage tens of thousands of servers, and fast enough to communicate with those servers in seconds. PyPI link
Why Averages Suck and Percentiles are Great.
monigusto — living the 'monitoring up' dream. (набор chief рецептов для построения системы мониторинга на Ubuntu).
UX / Business metrics: is there a problem?
System monitors: where is the problem?
Application monitors: what is the problem?
2015/02/02
The Elasticsearch ELK Stack
By combining the massively popular Elasticsearch, Logstash and Kibana we have created an end-to-end stack that delivers actionable insights in real-time from almost any type of structured and unstructured data source. Built and supported by the engineers behind each of these open source products, the Elasticsearch ELK stack makes searching and analyzing data easier than ever before.
Used as a stand-alone application to provide strategic business insights or integrate with your existing applications to power their interactions with incoming data. Thousands of organizations worldwide use the Elasticsearch ELK stack for an endless variety of business critical functions.
URL: http://www.elasticsearch.org/Riemann monitors distributed systems
Riemann aggregates events from your servers and applications with a powerful stream processing language. Send an email for every exception raised by your code. Track the latency distribution of your web app. See the top processes on any host, by memory and CPU. Combine statistics from every Riak node in your cluster and forward to Graphite. Send alerts when a key process fails to check in. Know how many users signed up right this second.
Riemann provides low-latency, transient shared state for systems with many moving parts.
2014/09/03
Графит
Со вчерашнего я под приятным впечатлением от прочтения блога руководителя группы тестирования Яндекс Артема Кошелева, а также от интересных, а порой и нудных лекций в Курсах информационных технологий (КИТ) от Яндекса.
Очень понравилась система мониторинга на Графите, которую используют в Яндекс, а также системе нагрузочного тестирования Яндекс.Танк.
Ссылочки:Wikipedia - Graphite
Graphite - Scalable Realtime Graphing
Graphite — как построить миллион графиков. Дмитрий Куликовский, Яндекс
Графики и Яндекс.Танк. Яндекс.
Наши танки. История нагрузочного тестирования в Яндексе
Тестирование в Яндексе: строим свой Лунапарк (Яндекс)
Яндекс.Танк - инструмент для проведения нагрузочного тестирования и анализа производительности веб-сервисов и приложений.
Github: Yandex-tank
Github (fork): Diamond (чем собирают данные с серверов)
offtop про мониторинг
Блог Matthew Barlocker: Architected Availability
Grafana
Kibana
Kale — open source-инструмент для обнаружения и корреляции аномалий
Shinken
Sensu
Time Series, метрики и статистика: знакомство с InfluxDB
Scripting Grafana dashboards
GUI for statsd other than Graphite
Tessera - dashbord for graphite
Icinga
Cabotapp - Cabot - monitor and alert (Get alerted when services go down or metrics go crazy)
Statsify — is a .NET port of Graphite/CollectD/StatsD. Statsify allows you to collect server-level and application-level metrics, store them in a time-series database, perform reporting and render beautiful graphs.
Graphite PowerShell Functions — A group of PowerShell functions that allow you to send Windows Performance counters to a Graphite Server, all configurable from a simple XML file.
http://habrahabr.ru/post/232767/#comment_7852533:
У нас как раз для сбора и анализа логов используется связка logstash-elasticsearch-kibana. Kibana только визуализирует данные, elasticsearch хранит, logstash — парсит. Logstash хороший парсер логов: много фильтров из коробки плюс возможность создавать свои средствами регулярных выражений или более простых grok выражений. Рекомедую попробовать.
2012/11/02
2011/09/13
Обработка SNMP-трапов
В качестве обработчика SNMP-трапов, чтобы можно было читать человеческим языком события с сетевых устройств, можно было использовать SNMPTT, но с ним как-то не сложилось. Написал свой велосипед для Dlink DES-35XX и DES-32XX серий.
Snmptrapd запускаю с флагами -On. Самвелосипед скрипт тут, конфигурационный файл прилагается. Умеет распихивать события из сетей по разным файлам.
На выходе получается что-то вроде такого:
Snmptrapd запускаю с флагами -On. Сам
На выходе получается что-то вроде такого:
2011/08/03
Снимаем по SNMP статистику BIND9

Не знаю кому это будет интересно :) Я пока для себя решил подержать так недельку-другую, посмотрю на статистку. Пока добавил в crontab:
*/5 * * * * /usr/sbin/rndc statsЗатем установил Net-SNMP и добавил в snmpd.conf:
Скрипт bind96-stats-get.sh
После запуска snmpd можно обращаться с помощью Zabbix-агента с помощью SNMP к oid-ам: bind9-success, bind9-fail, bind9-nxdomain, bind9-recursion, bind9-dropped и bind9-othfail. Найти их можно так:
snmpwalk -c public -v2c localhost .1.3.6.1.4.1.2021.Конфигурацию Zabbix опущу. Идея и скрипты тут: Monitoring BIND9 UPDATE: 25/04/12
Syslog-ng в связке с jabber
Góður dagur!
Я как-то уже рассказывал, что мы используем Zabbix с jabber, syslog-ng — не исключение. Цель: получать вовремя нужные события по мере их поступления :) Вообще syslog-ng зарекоммендовал себя отлично, т.к. умеет работать с регулярными выражениями, сетевыми адресами, раскладывая по определённым правилам события в файлы, и многое др. Jabber-клиент все тот-же. Пример конфига (немного его изменил, но суть ясна):
Содержимое файла /usr/local/etc/syslog-ng-jabber.pl:
Я как-то уже рассказывал, что мы используем Zabbix с jabber, syslog-ng — не исключение. Цель: получать вовремя нужные события по мере их поступления :) Вообще syslog-ng зарекоммендовал себя отлично, т.к. умеет работать с регулярными выражениями, сетевыми адресами, раскладывая по определённым правилам события в файлы, и многое др. Jabber-клиент все тот-же. Пример конфига (немного его изменил, но суть ясна):
Содержимое файла /usr/local/etc/syslog-ng-jabber.pl:
2011/06/08
Orange Equipment Manager
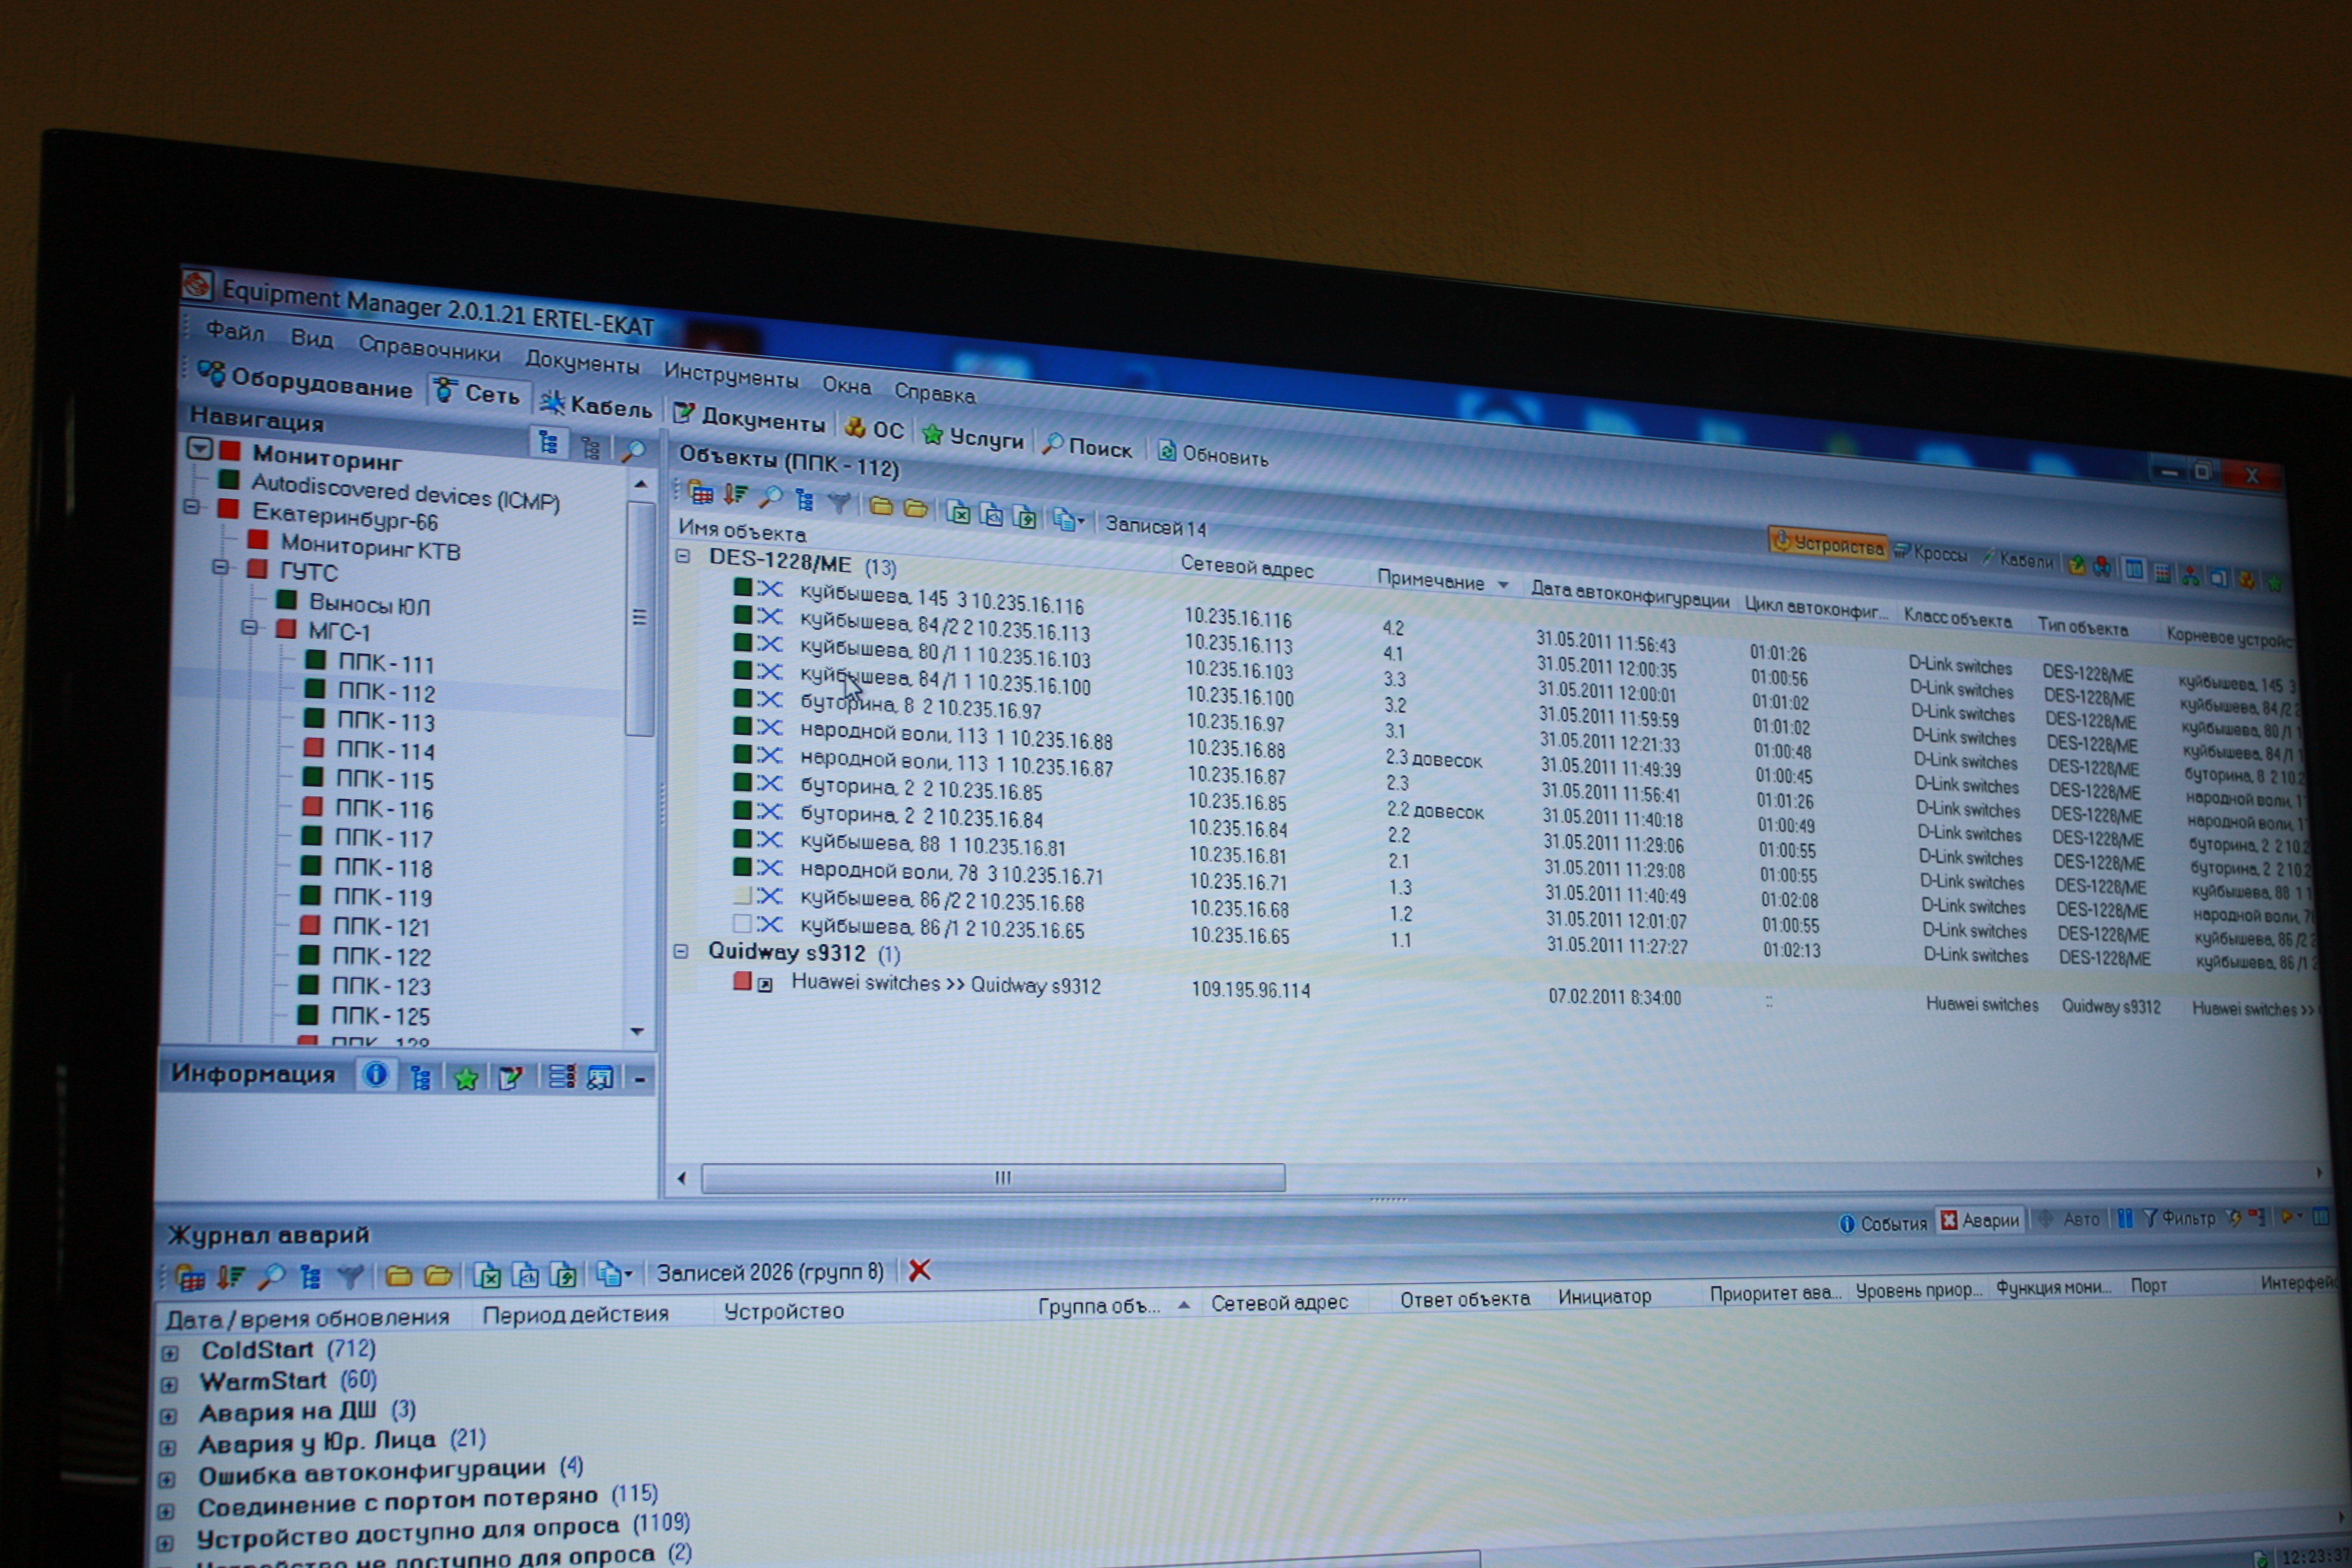
Картинка взята из этой статьи: Nag: Как выглядит Центральная Головная Станция
Orange Equipment Manager
Подписаться на:
Сообщения (Atom)